PageSpeed most commonly refers to Google PageSpeed Insights — a free tool from Google that analyzes the performance of a web page and provides scores and recommendations for improving load time and user experience. More broadly, “page speed” describes how quickly a web page loads and becomes usable for a visitor. The two meanings are often used interchangeably, though they’re technically distinct: PageSpeed Insights is the tool, and page speed is the underlying performance characteristic it measures.
Page speed is a direct Google ranking factor. Since 2018’s Speed Update, load time has influenced mobile search rankings — and since 2021, Google’s Core Web Vitals (a set of real-world performance metrics) have been incorporated into Google’s ranking algorithm. Slow pages don’t just rank lower — they also lose visitors. Google’s own research found that as page load time increases from one second to three seconds, the probability of a visitor bouncing increases by 32%. From one second to five seconds, that probability jumps 90%.
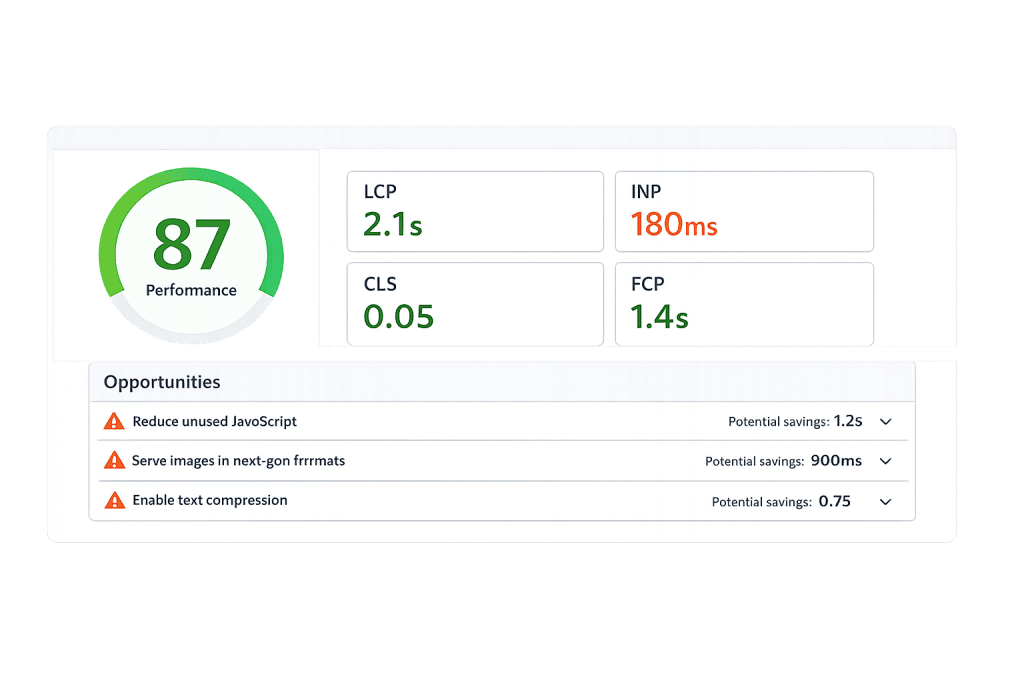
[Image: Google PageSpeed Insights results for a URL, showing the Performance score, Core Web Vitals metrics (LCP, FID/INP, CLS), and a list of improvement opportunities]
How Google PageSpeed Insights Works
PageSpeed Insights evaluates a page through two lenses:
Lab data — A simulated test run in a controlled environment using Lighthouse, an automated auditing tool. Lab data measures metrics under standardized conditions and generates the 0–100 Performance score most people recognize.
Field data (Core Web Vitals) — Real-world performance data collected from actual users visiting the page through the Chrome User Experience Report (CrUX). This data reflects how the page actually performs in the real world across different devices and network conditions.
The Performance score in PageSpeed Insights is calculated primarily from five Lighthouse metrics:
- First Contentful Paint (FCP) — When the first piece of content appears on screen
- Largest Contentful Paint (LCP) — When the largest visible element fully loads; Google’s Core Web Vitals threshold is under 2.5 seconds
- Total Blocking Time (TBT) — How long the main thread is blocked from responding to user input (a proxy for First Input Delay / INP)
- Cumulative Layout Shift (CLS) — How much the page layout shifts unexpectedly as it loads
- Speed Index — How quickly page content is visually populated
An important nuance: the score itself (0–100) is not used as a direct Google ranking signal. What matters for rankings is the real-world field data — specifically whether a page passes Core Web Vitals thresholds — not whether the Lighthouse score is 72 or 95.
Purpose & Benefits
1. SEO Ranking Signal
Page speed directly affects where your pages rank in Google search results. Pages that fail Core Web Vitals — specifically Largest Contentful Paint (LCP), Cumulative Layout Shift (CLS), and Interaction to Next Paint (INP) — are at a ranking disadvantage compared to pages that pass. Our SEO services and speed optimization services address the full stack of performance issues that affect these signals.
2. Reduced Bounce Rate and Better User Experience
Slow pages lose visitors before they ever engage with your content. A one-second delay in mobile load time reduces conversions by up to 20%, according to Google’s research. Faster pages don’t just rank better — they convert better. Every second you remove from your page load time is recovered revenue from visitors who would otherwise have left before the page finished loading.
3. Mobile Performance Matters More Than Ever
Over 58% of all web searches now happen on mobile devices. Google uses mobile-first indexing, meaning it primarily uses the mobile version of your site for ranking. PageSpeed performance on mobile is often significantly worse than on desktop — particularly on sites with unoptimized images, large JavaScript bundles, or complex page builders. Improving mobile PageSpeed directly supports your search rankings and user experience for the majority of your visitors.
Examples
1. WordPress Site Boosted by Image Optimization and Caching
A business website built on WordPress scores 41 on mobile PageSpeed due to large unoptimized images, no caching, and unminified CSS/JS files. After implementing lazy loading, running images through compression, setting up a server-side caching plugin, and applying minification, the score improves to 76 and LCP drops from 5.2 seconds to 2.1 seconds — now passing Core Web Vitals.
2. eCommerce Product Pages Improved by Code Cleanup
An online retailer’s product pages are loaded with third-party tracking scripts and large hero images. Auditing PageSpeed Insights reveals that render-blocking JavaScript is delaying visible content by over 3 seconds. After deferring non-critical scripts, switching to a content delivery network (CDN), and replacing oversized hero images with optimized WebP files, LCP improves by 40% and organic search rankings lift for key product queries.
3. Agency Conducting Pre-Launch Performance Review
Before launching a redesigned client website, a web agency runs every key page through PageSpeed Insights and Lighthouse. Several pages fail LCP due to a large above-the-fold background image. The image is preloaded, converted to WebP, and sized appropriately for each breakpoint. The fix catches a Core Web Vitals failure before it affects rankings on the new site.
Common Mistakes to Avoid
- Obsessing over the score instead of the Core Web Vitals — The 0–100 performance score is a useful diagnostic tool, but it’s not what Google uses for rankings. Focus on passing the field-data Core Web Vitals thresholds rather than chasing a perfect Lighthouse score.
- Only testing desktop — Google’s ranking signal comes from mobile field data. Always check the mobile tab in PageSpeed Insights — scores can differ dramatically, and mobile is what matters most for SEO.
- Treating PageSpeed as a one-time fix — Page performance degrades over time as content is added, plugins are installed, and themes are updated. Ongoing monitoring and regular audits are part of maintaining a fast site.
- Ignoring third-party scripts — Analytics tools, chat widgets, ad scripts, and social media embeds all add load time. Auditing and removing unused third-party scripts is often the single highest-impact step in a PageSpeed improvement project.
Best Practices
1. Optimize Images Before Uploading
Large, uncompressed images are the most common cause of poor PageSpeed scores on WordPress sites. Convert images to WebP format (which Google recommends), compress them before uploading, and size them appropriately for how they’ll be displayed. Pair this with lazy loading to defer off-screen images from loading until a visitor scrolls toward them.
2. Use Caching and a CDN
Server caching stores pre-built versions of your pages so they’re delivered quickly without regenerating on each visit. A content delivery network (CDN) distributes your static assets (images, CSS, JavaScript) from servers geographically close to your visitors. Together, these two approaches reduce server response time and improve PageSpeed scores — particularly for sites with geographically distributed audiences.
3. Minimize and Defer JavaScript and CSS
Render-blocking resources — CSS and JavaScript that must load before the browser can display page content — are a consistent source of poor LCP scores. Use minification to reduce file sizes, consolidate CSS files where possible, and defer or asynchronously load non-critical JavaScript. Most WordPress caching plugins include options for these optimizations.
Frequently Asked Questions
Is a PageSpeed score of 100 necessary for good SEO?
No. A score of 100 on Lighthouse’s Performance audit is rarely necessary and often impractical for WordPress sites with dynamic content, third-party integrations, and rich media. What matters for Google rankings is whether your page passes the Core Web Vitals thresholds in field data — not whether the lab-based score hits a particular number.
What’s the difference between PageSpeed Insights and Core Web Vitals?
PageSpeed Insights is the tool — it displays both lab data (Lighthouse scores) and field data (Core Web Vitals from real users). Core Web Vitals are the specific metrics Google uses as a ranking signal: LCP, CLS, and INP. A PageSpeed Insights audit shows whether your pages pass or fail Core Web Vitals alongside the broader performance score.
Why does my desktop score look fine but my mobile score is poor?
Mobile devices have less processing power and often operate on slower network connections than desktop environments. PageSpeed Insights tests mobile under throttled conditions (simulating a mid-range Android phone on 4G) while desktop tests assume faster conditions. Images and JavaScript that load quickly on desktop may perform significantly worse on mobile.
How often should I check my PageSpeed scores?
Check after any significant site change — plugin updates, theme updates, new page designs, or new third-party integrations. Also check quarterly as part of routine site maintenance. For active e-commerce or lead generation sites where performance directly impacts revenue, monthly monitoring is reasonable.
Related Glossary Terms
- Core Web Vitals
- Largest Contentful Paint (LCP)
- Cumulative Layout Shift (CLS)
- Lazy Loading
- Minification
- Content Delivery Network (CDN)
- Caching
How CyberOptik Can Help
Page performance directly affects where you rank and whether visitors stay long enough to become customers. We offer dedicated speed optimization services and manage performance as part of our broader SEO and hosting engagements — so your site stays fast as it grows. Contact us for a free website review, learn about our speed optimization services, or explore our SEO services.