Conversion rate is the percentage of website visitors who complete a desired action during a given period. It’s calculated by dividing the number of conversions by the total number of visitors (or sessions), then multiplying by 100. If 2,000 people visit your site in a month and 60 submit a contact form, your conversion rate is 3%.
Conversion rate is one of the most important metrics in digital marketing because it measures website effectiveness directly, not just traffic volume. A site that converts 4% of its visitors outperforms one that converts 1%, even if the lower-converting site gets three times the traffic. Improving conversion rate means getting more value from the audience you already have — without spending more on acquisition.
Key Concepts
Several variables affect how conversion rate is calculated and interpreted:
Conversion event definition — Your conversion rate is only as meaningful as the goal you’re measuring. A contact form submission, a phone call, an online purchase, an email sign-up, and a page view are all potential conversion events with very different values. Always specify which conversion you’re measuring when reporting rates.
Denominator choice — Conversion rate can be calculated per session (how many sessions resulted in a conversion) or per user (how many unique users converted). The denominator you use changes the number significantly, especially for sites with high return visitor rates.
Traffic source segmentation — An aggregate conversion rate hides important variance. Email marketing visitors often convert at 2.8%; paid display visitors may convert at 0.3%. Segmenting conversion rate by source, campaign, device, and landing page reveals far more useful information than a single average.
Time period and sample size — Conversion rate fluctuates with traffic volume, seasonality, promotions, and external events. Ensure you’re comparing equivalent periods and that sample sizes are large enough to be statistically meaningful before drawing conclusions.
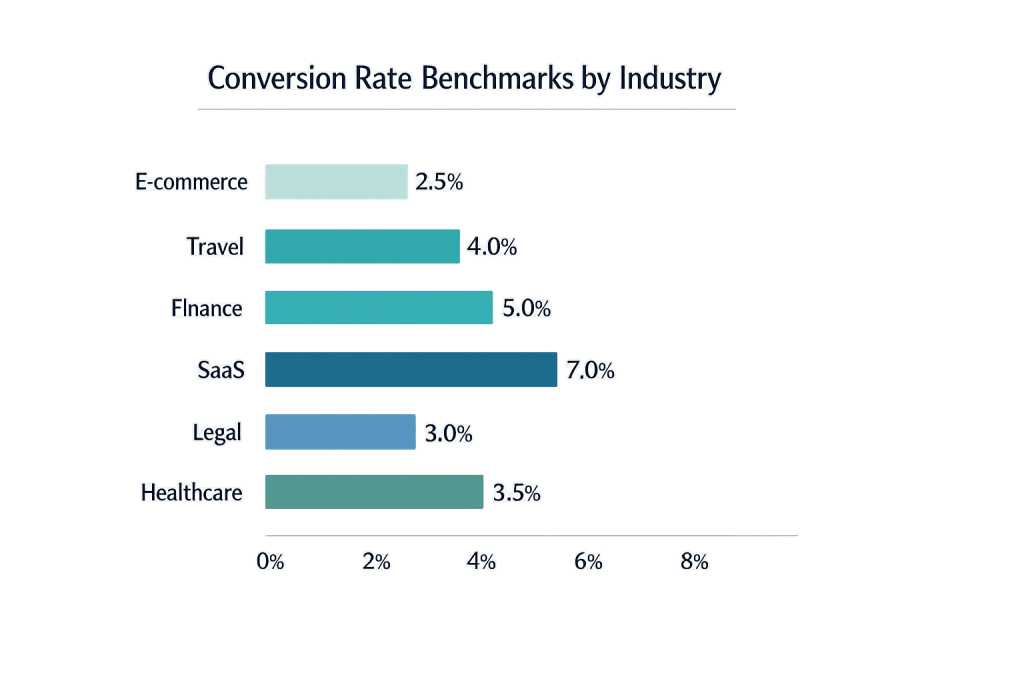
Conversion Rate Benchmarks by Industry
Knowing your own rate matters most, but industry benchmarks provide useful context for whether a site is performing well or leaving significant opportunity on the table.
E-commerce: The average conversion rate for e-commerce websites is approximately 2-3%. Arts and crafts sites see rates around 4-5%, while luxury goods hover under 1.5%. Amazon Prime customers convert at rates as high as 13%, reflecting the power of frictionless checkout and stored payment information.
B2B Services: Lead generation conversion rates vary widely — from 1.7% to over 10% depending on the industry. Legal services average around 7.4% on B2B websites. HVAC services average approximately 3.1% due to high purchase urgency.
SaaS and Software: Free trial conversion rates typically range from 3-5% of visitors to trial sign-ups, with 25-60% of trial users converting to paid subscriptions — a wide range driven by onboarding quality and product-market fit.
Healthcare: Appointment booking and consultation request conversion rates average 2.8-4.2% for healthcare providers, with high-performing practices reaching 10%+.
Financial Services: Financial services websites see median conversion rates around 8.3% (per Unbounce data), with insurance lead generation achieving rates as high as 18.2% in some segments.
The overall average across all industries, per multiple analytics benchmarks, sits around 2-3%. If your site converts below 1%, there’s likely a significant friction point worth investigating.
[Image: Bar chart showing conversion rate benchmarks by industry]
Purpose & Benefits
1. Measures the True ROI of Marketing Investment
Traffic is a vanity metric without conversion data to accompany it. Conversion rate connects your marketing spend to business outcomes. A $5,000 monthly paid search budget generating 200 conversions at a 2% rate is measurably more or less efficient depending on what each conversion is worth. Our digital marketing services consistently use conversion rate as the primary performance indicator, not traffic volume.
2. Multiplies the Value of Existing Traffic
Doubling your traffic might require doubling your marketing budget. Doubling your conversion rate requires no additional traffic — just a more effective site. A 1% improvement in conversion rate on a site receiving 5,000 monthly visitors is 50 additional conversions per month. At a $500 average customer value, that’s $25,000 in potential additional revenue from the same traffic.
3. Provides a Continuous Improvement Framework
Conversion rate is measurable, attributable to specific pages and experiences, and improvable through systematic testing. This makes it the foundation of conversion rate optimization (CRO) — a structured process of testing hypotheses, measuring results, and implementing improvements. Unlike brand awareness or sentiment, conversion rate gives you concrete feedback on whether changes are working.
Examples
1. Law Firm Improving Lead Form Submissions
A personal injury law firm has a homepage conversion rate of 0.8% — below the legal services average of 4%. Analysis reveals the contact form has 12 required fields, creating high friction. After reducing the form to 4 fields (name, phone, email, case type) and moving it above the fold, the conversion rate improves to 2.4% — a 3x improvement without changing a dollar of the marketing budget.
2. E-Commerce Store Improving Checkout Completion
An outdoor gear retailer’s add-to-cart conversion rate is 8%, but the checkout completion rate is only 28% of carts started — well below the e-commerce average. Funnel analysis reveals that unexpected shipping costs appear at the final checkout step. Adding a free-shipping threshold ($75+) and showing shipping cost estimates on product pages increases checkout completion to 41% — a meaningful improvement to the bottom of the funnel.
3. SaaS Company Improving Trial-to-Paid Conversion
A project management software company’s trial sign-up conversion rate is 4.2% — on target for the industry. But their trial-to-paid conversion rate is only 12%, significantly below their 25% internal target. They run a series of A/B tests on their onboarding email sequence, specifically the first 48 hours of the trial experience. Improving the onboarding welcome email and adding a first-session tooltip guide increases trial-to-paid conversion to 19%.
Common Mistakes to Avoid
- Reporting aggregate conversion rate without segmentation — A 2% overall conversion rate might be 5% from email, 3% from organic, and 0.5% from display ads. Reporting only the aggregate hides both problems and opportunities. Always segment.
- Making changes without establishing a baseline — Before testing anything, document your current conversion rate with sufficient data to be statistically meaningful. Without a reliable baseline, you can’t determine whether an improvement is real or within normal variance.
- Chasing industry benchmarks instead of your own improvement — Industry benchmarks are useful context, but your real goal is continuous improvement of your own rate, not matching someone else’s average. A highly targeted, niche site might naturally convert lower than a mass-market competitor and still be performing well.
- Treating conversion rate in isolation from conversion volume — A 10% conversion rate on 50 monthly visitors (5 conversions) is less valuable than a 3% rate on 2,000 visitors (60 conversions). Conversion rate and volume should always be evaluated together to understand total business impact.
Best Practices
1. Implement Conversion Tracking Before Driving Traffic
Set up goal tracking in Google Analytics or your preferred platform before any marketing campaign goes live. Every visitor who arrives without conversion tracking is a missed data point. For businesses running paid search, tracking gaps mean optimization algorithms can’t learn from conversion data — wasting budget on the least efficient segments.
2. Reduce Friction at Every Stage
Most conversion rate problems are friction problems. Forms with too many fields, checkout processes with too many steps, pages that don’t clearly state what to do next — all of these create friction that stops willing visitors from converting. Audit your key conversion paths for unnecessary steps and remove them. The research on form fields shows that reducing from 5 to 1 field improves completion rates by nearly 30 percentage points.
3. Align Landing Page Messaging With Ad or Search Intent
Conversion rate drops sharply when there’s a mismatch between what a visitor expected when they clicked and what they find when they arrive. If an ad promises “free shipping on orders over $50,” the landing page should immediately confirm that. If a search ad targets “emergency plumber,” the landing page should prominently feature emergency availability and a phone number. Message match between traffic source and destination is one of the highest-leverage conversion improvements available.
Frequently Asked Questions
What is a good conversion rate for a website?
The baseline average across industries is approximately 2-3%. A rate above 5% is generally considered strong. However, “good” depends heavily on your industry, traffic sources, and what counts as a conversion. Legal services and financial services sites often convert higher than e-commerce in lead-generation terms. Focus on improving your own baseline rather than chasing a universal number.
How do I increase my website’s conversion rate?
Start by identifying your biggest drop-off points with funnel analysis. Then test specific improvements: reducing form fields, strengthening calls-to-action, adding social proof (testimonials, reviews, trust badges), improving page load speed, and ensuring clear value propositions. Use A/B testing to validate that changes actually improve performance before making them permanent.
How does page speed affect conversion rate?
Significantly. Studies consistently show that each second of additional load time reduces conversions by a measurable percentage. A one-second delay in mobile load times can reduce conversions by 7-20% depending on the study. Fast sites convert better because they reduce the friction of waiting — and because Google’s Core Web Vitals standards make page speed a ranking factor, fast sites also get better traffic quality from organic search.
Is a 1% conversion rate bad?
It depends on context. For a complex B2B product with a $50,000 contract value, 1% of highly targeted traffic converting might represent strong performance. For a simple consumer product checkout, 1% suggests significant friction. Always evaluate conversion rate relative to the value of each conversion and the quality of the incoming traffic, not as an absolute number.
How is conversion rate different from click-through rate?
Click-through rate (CTR) measures clicks relative to impressions — how many people click on your ad or search result. Conversion rate measures completed actions relative to site visitors — how many people who land on your site then do something meaningful. CTR measures traffic acquisition; conversion rate measures what happens after traffic arrives.
Related Glossary Terms
- Conversion
- CRO (Conversion Rate Optimization)
- A/B Testing
- Conversion Funnel
- Conversion Tracking
- Click-Through Rate (CTR)
- Bounce Rate
How CyberOptik Can Help
Getting conversion rate right takes strategy, consistent execution, and clear measurement — all things our marketing team delivers for clients every day. Whether you need help establishing baseline conversion tracking, running A/B tests on high-traffic pages, or redesigning key conversion flows, we can help you turn more of your existing traffic into real business results. Explore our marketing services or get in touch.