Understanding how visitors interact with your website can transform your business outcomes. Heatmap plugins reveal precisely where users click, how far they scroll, and what elements grab their attention. This visual insight helps identify hidden conversion barriers and optimization opportunities.
We’ve helped countless Chicago businesses turn website data into actionable improvements using heatmap tools. These plugins show you exactly what’s working on your site and what needs fixing.
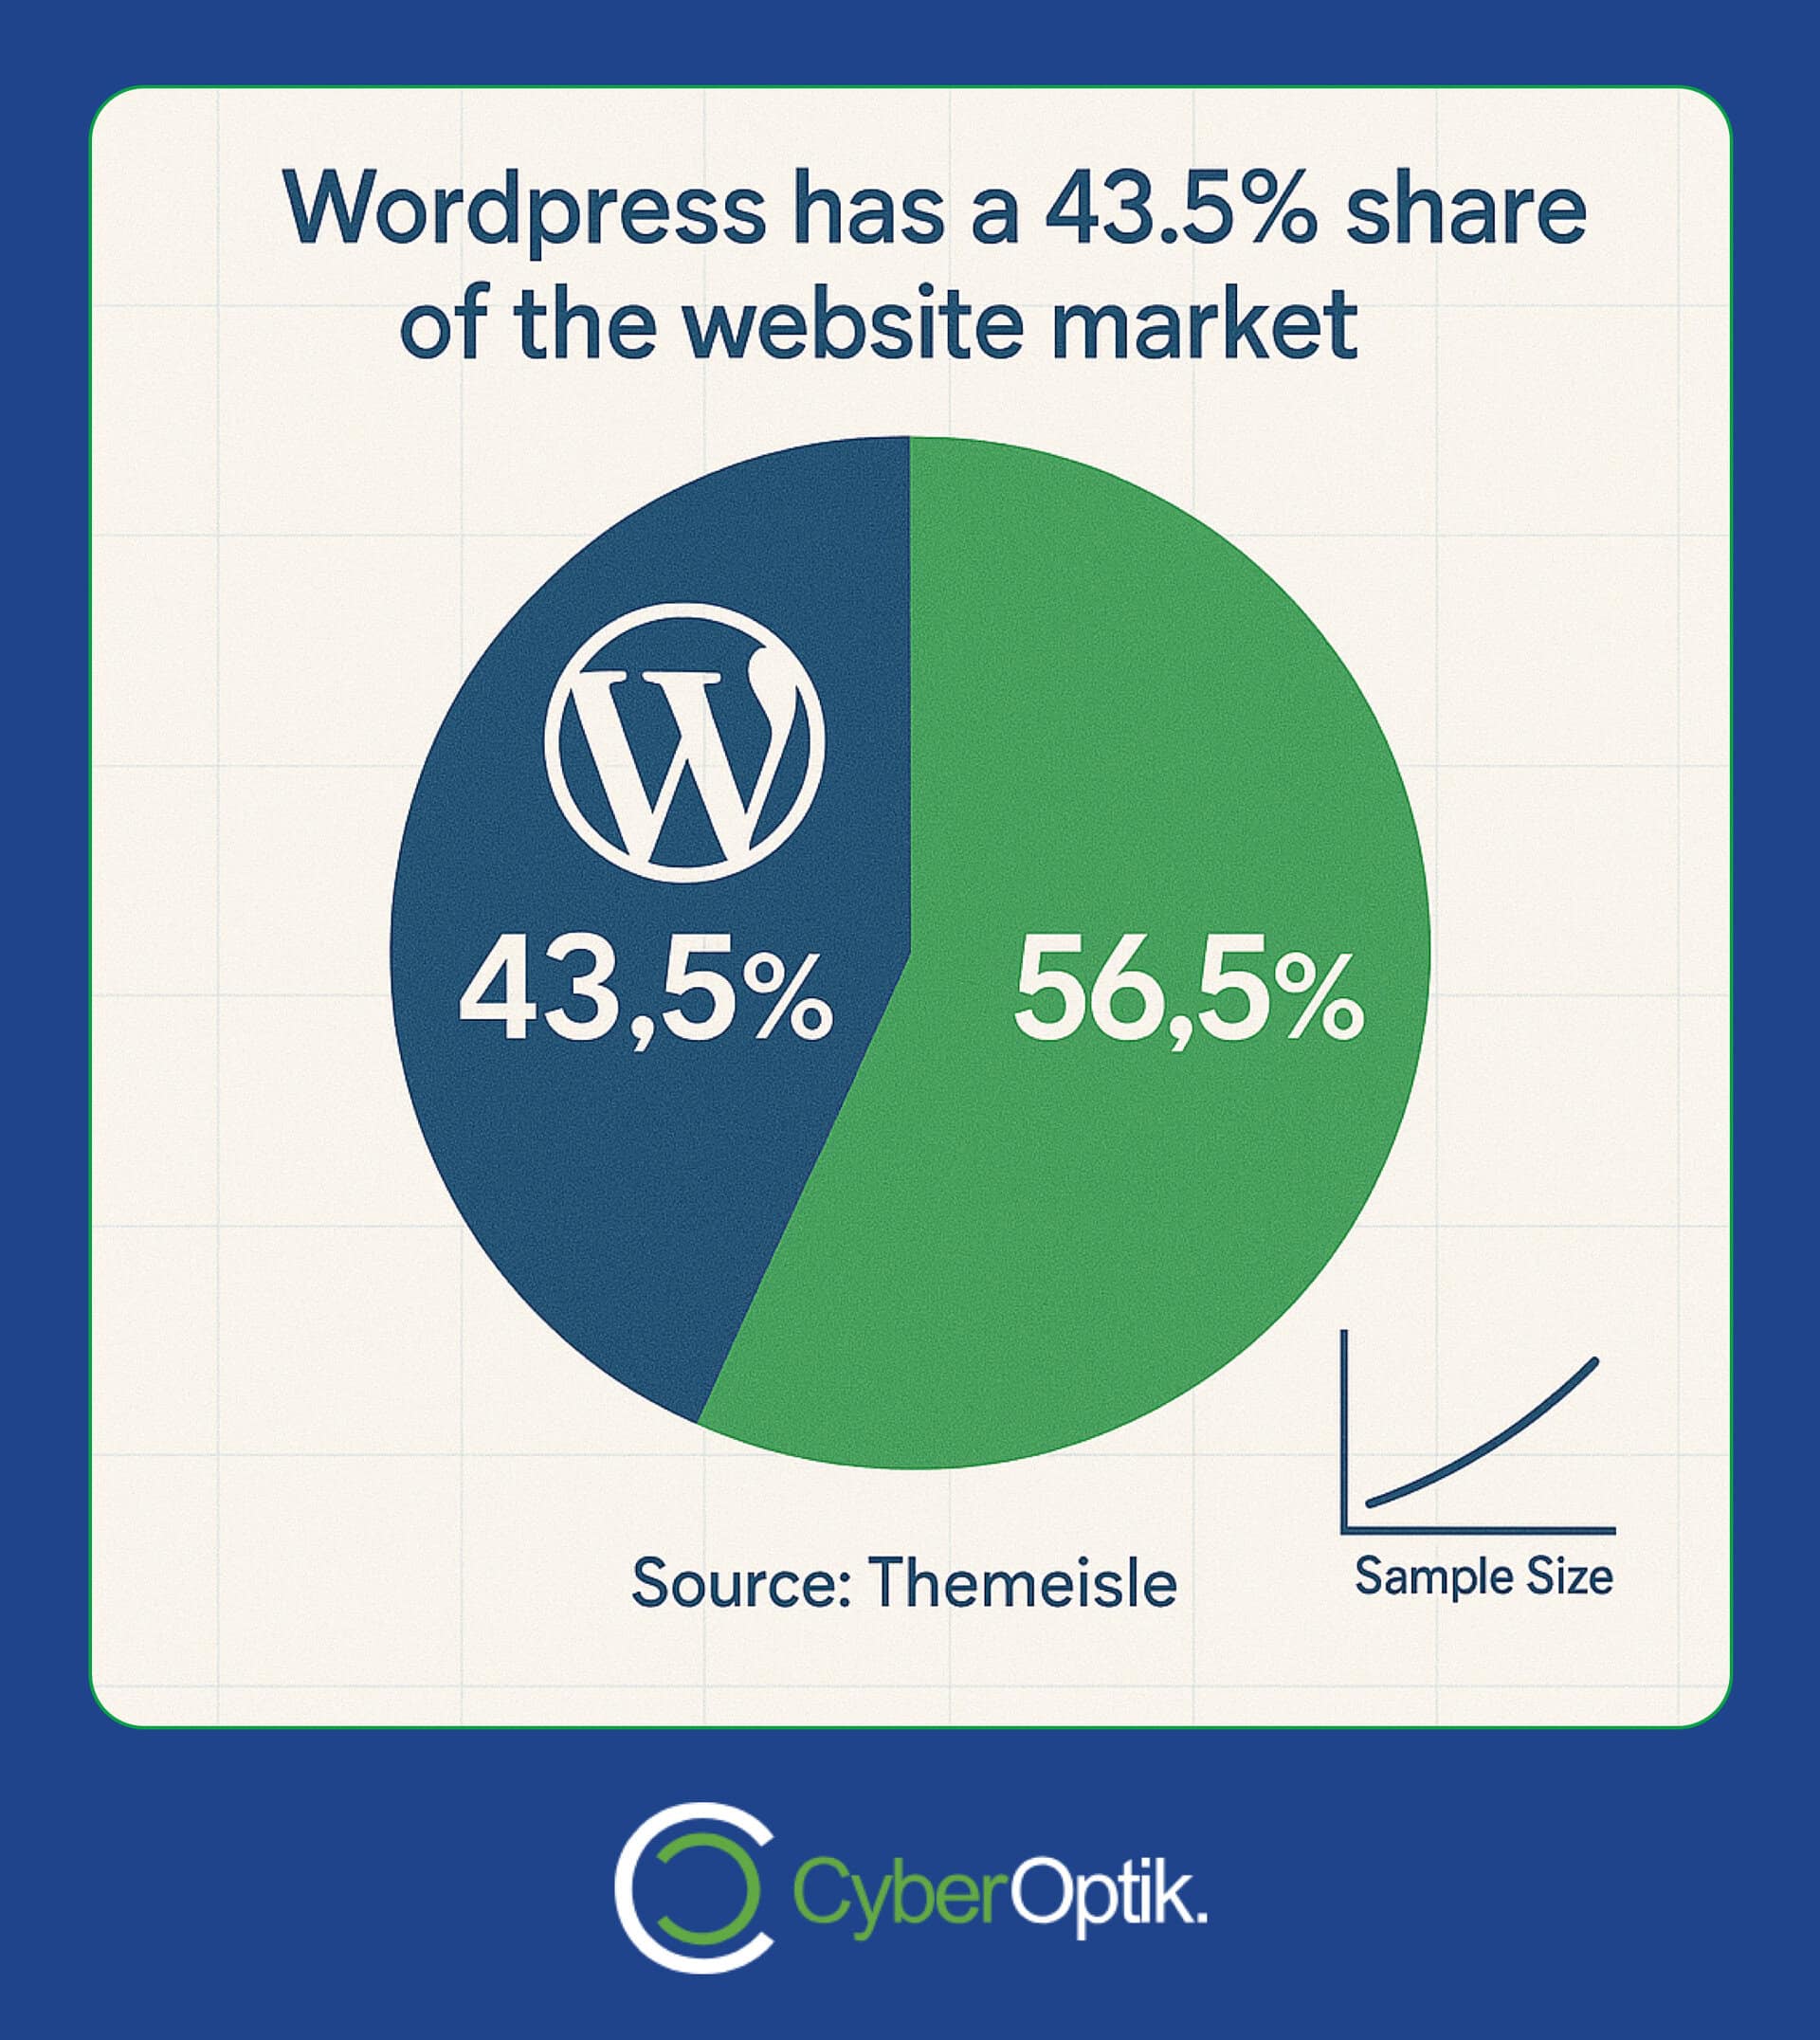
WordPress powers a remarkable 43.5% of all websites as of April 2025, making it the most popular content management system globally.
Let’s examine the best WordPress heatmap plugins that can help you understand user behavior and improve site performance.
What Are WordPress Heatmap Plugins and Why They Matter
Heatmap plugins visualize user activity on your website. They convert complex behavioral data into color-coded maps showing where visitors click, move their cursor, and how far they scroll. This visual format makes it easy to spot patterns and problems.
For business owners, these insights are gold. They reveal whether visitors find your call-to-action buttons, read your content fully, or get confused by your layout. Without this data, you’re essentially guessing what works on your site.
The connection to website performance is direct. When you know exactly how users interact with your pages, you can make targeted improvements that boost engagement, reduce bounce rates, and increase conversions.
| Heatmap Type | What It Shows | Business Value |
|---|---|---|
| Click Heatmap | Where users click or tap | Identify if CTAs are being clicked or ignored |
| Scroll Heatmap | How far users scroll down | See if important content is being viewed |
| Movement Heatmap | Mouse movement patterns | Understand attention paths and interest areas |
| Session Recordings | Individual user journeys | Spot friction points and usability issues |
This table illustrates the different types of heatmaps and their specific business applications. Each type provides unique insights that help optimize different aspects of your website.
How Heatmap Plugins Improve Website Performance
Website performance goes beyond loading speed. It includes how effectively your site converts visitors into customers. Heatmaps directly influence this broader performance definition in several ways.
User behavior insights tell you exactly what content engages your audience. You can see precisely which elements attract attention and which get ignored. This knowledge helps prioritize improvements where they’ll have the greatest impact.
- Conversion pathway optimization – Identify and remove obstacles in your sales funnel
- Content effectiveness measurement – See if visitors are engaging with key information
- Layout and design validation – Confirm if your page structure works as intended
- Mobile experience assessment – Ensure responsive designs function properly across devices
The data from heatmaps helps create a smoother user experience. When visitors can easily find what they need, they’re more likely to stay longer and take desired actions. This improved engagement directly translates to better business outcomes.
By identifying where users get stuck or confused, you can optimize your site’s performance with targeted fixes rather than costly redesigns. This approach saves both time and money while delivering better results.
Key Features to Look for in WordPress Heatmap Plugins
Selecting the right heatmap plugin requires understanding which features matter most for your specific needs. Some plugins excel at detailed analytics while others focus on ease of use or performance impact.
The most valuable heatmap tools combine several data collection methods. They track not just where users click but also how they move through your site, where they pause, and how they interact with different elements.
| Feature Category | What to Look For | Why It Matters |
|---|---|---|
| Data Collection | Click tracking, scroll mapping, movement tracking, form analytics | Comprehensive data provides fuller picture of user behavior |
| Technical Impact | Loading speed effect, server load, asynchronous loading | Prevents the analytics tool from slowing down your site |
| Integration | Compatibility with other analytics, CRM systems, A/B testing tools | Creates a unified data ecosystem for better decision making |
| Reporting | Customizable reports, data export, team sharing capabilities | Makes insights accessible and actionable for your team |
This feature comparison helps identify which capabilities align with your specific business goals. Not every feature is essential for every website, so prioritize based on your particular needs.
Price is an important consideration, but value matters more than cost alone. Free options might seem attractive, but paid solutions often offer more robust data collection, better integration options, and superior support.
Performance impact deserves special attention. How does website loading speed affect your business? Any analytics tool that significantly slows down your pages can hurt user experience and search rankings, defeating the purpose of optimization.
Top WordPress Heatmap Plugins Compared
After analyzing the available heatmap solutions, we’ve identified the most effective options for WordPress sites. Each offers distinct advantages for different business needs and technical requirements.
1. Heatmap.com

Heatmap.com stands out for its revenue impact tracking capabilities. This premium tool connects user interactions directly to business outcomes, showing not just where visitors click but how those clicks translate to conversions and sales.
The platform offers real-time heatmaps that load asynchronously, meaning they won’t slow down your site while collecting data. This technical advantage is crucial for maintaining performance while gathering insights.
With pricing starting at $89/month, it represents a significant investment. However, for businesses where even small conversion improvements translate to substantial revenue gains, the ROI potential justifies the cost.
Ideal users include ecommerce sites, lead generation businesses, and companies with high-value conversion goals. The direct revenue tracking makes it particularly valuable for data-driven marketing teams.
2. Microsoft Clarity
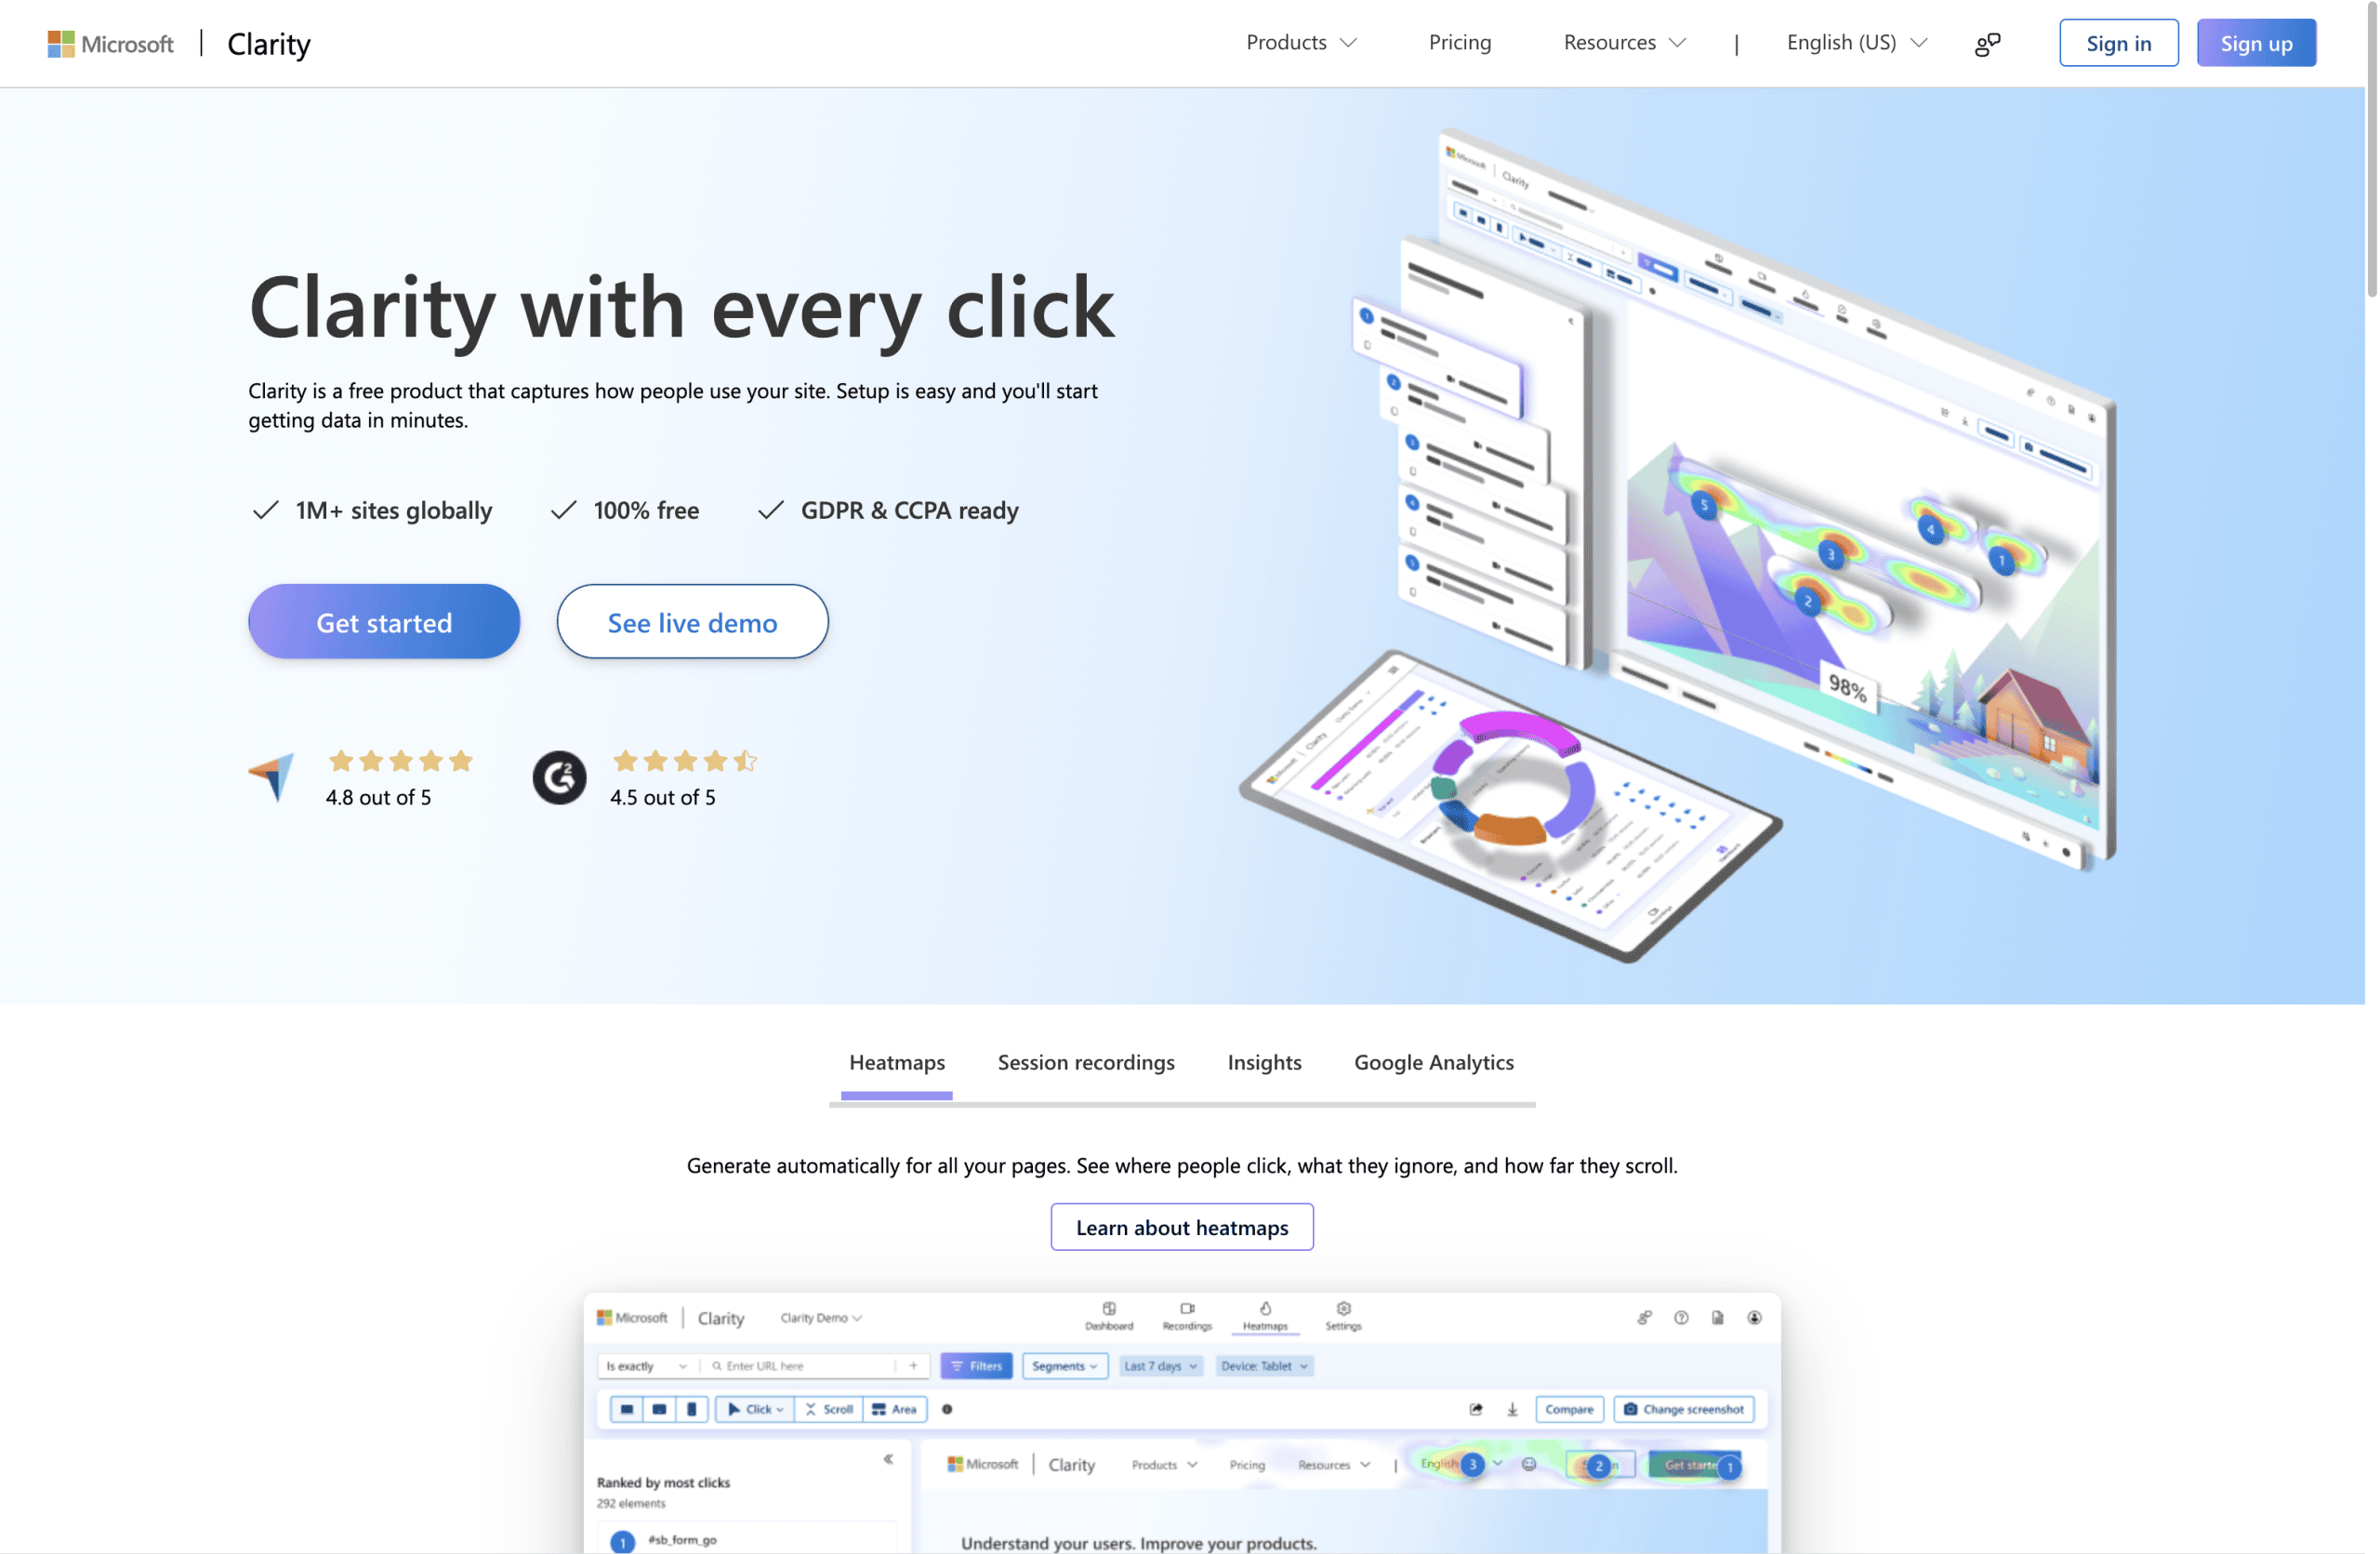
Microsoft Clarity provides completely free heatmaps and session recordings with no usage limits. This makes it an exceptional value, especially for small businesses and startups with limited budgets.
Despite being free, Clarity offers surprisingly robust features. The interface is intuitive, making it accessible even for team members without technical expertise. This democratizes data across your organization.
The platform integrates seamlessly with Google Analytics, creating a more complete picture when combined with your existing analytics setup. This connection helps correlate behavioral insights with traffic metrics.
Clarity works well for businesses just beginning with user experience optimization, small to medium websites, and teams looking to build a case for more extensive UX investments. Its zero-cost entry point makes it easy to get started with heatmap analysis.
3. VWO Heatmap Tool
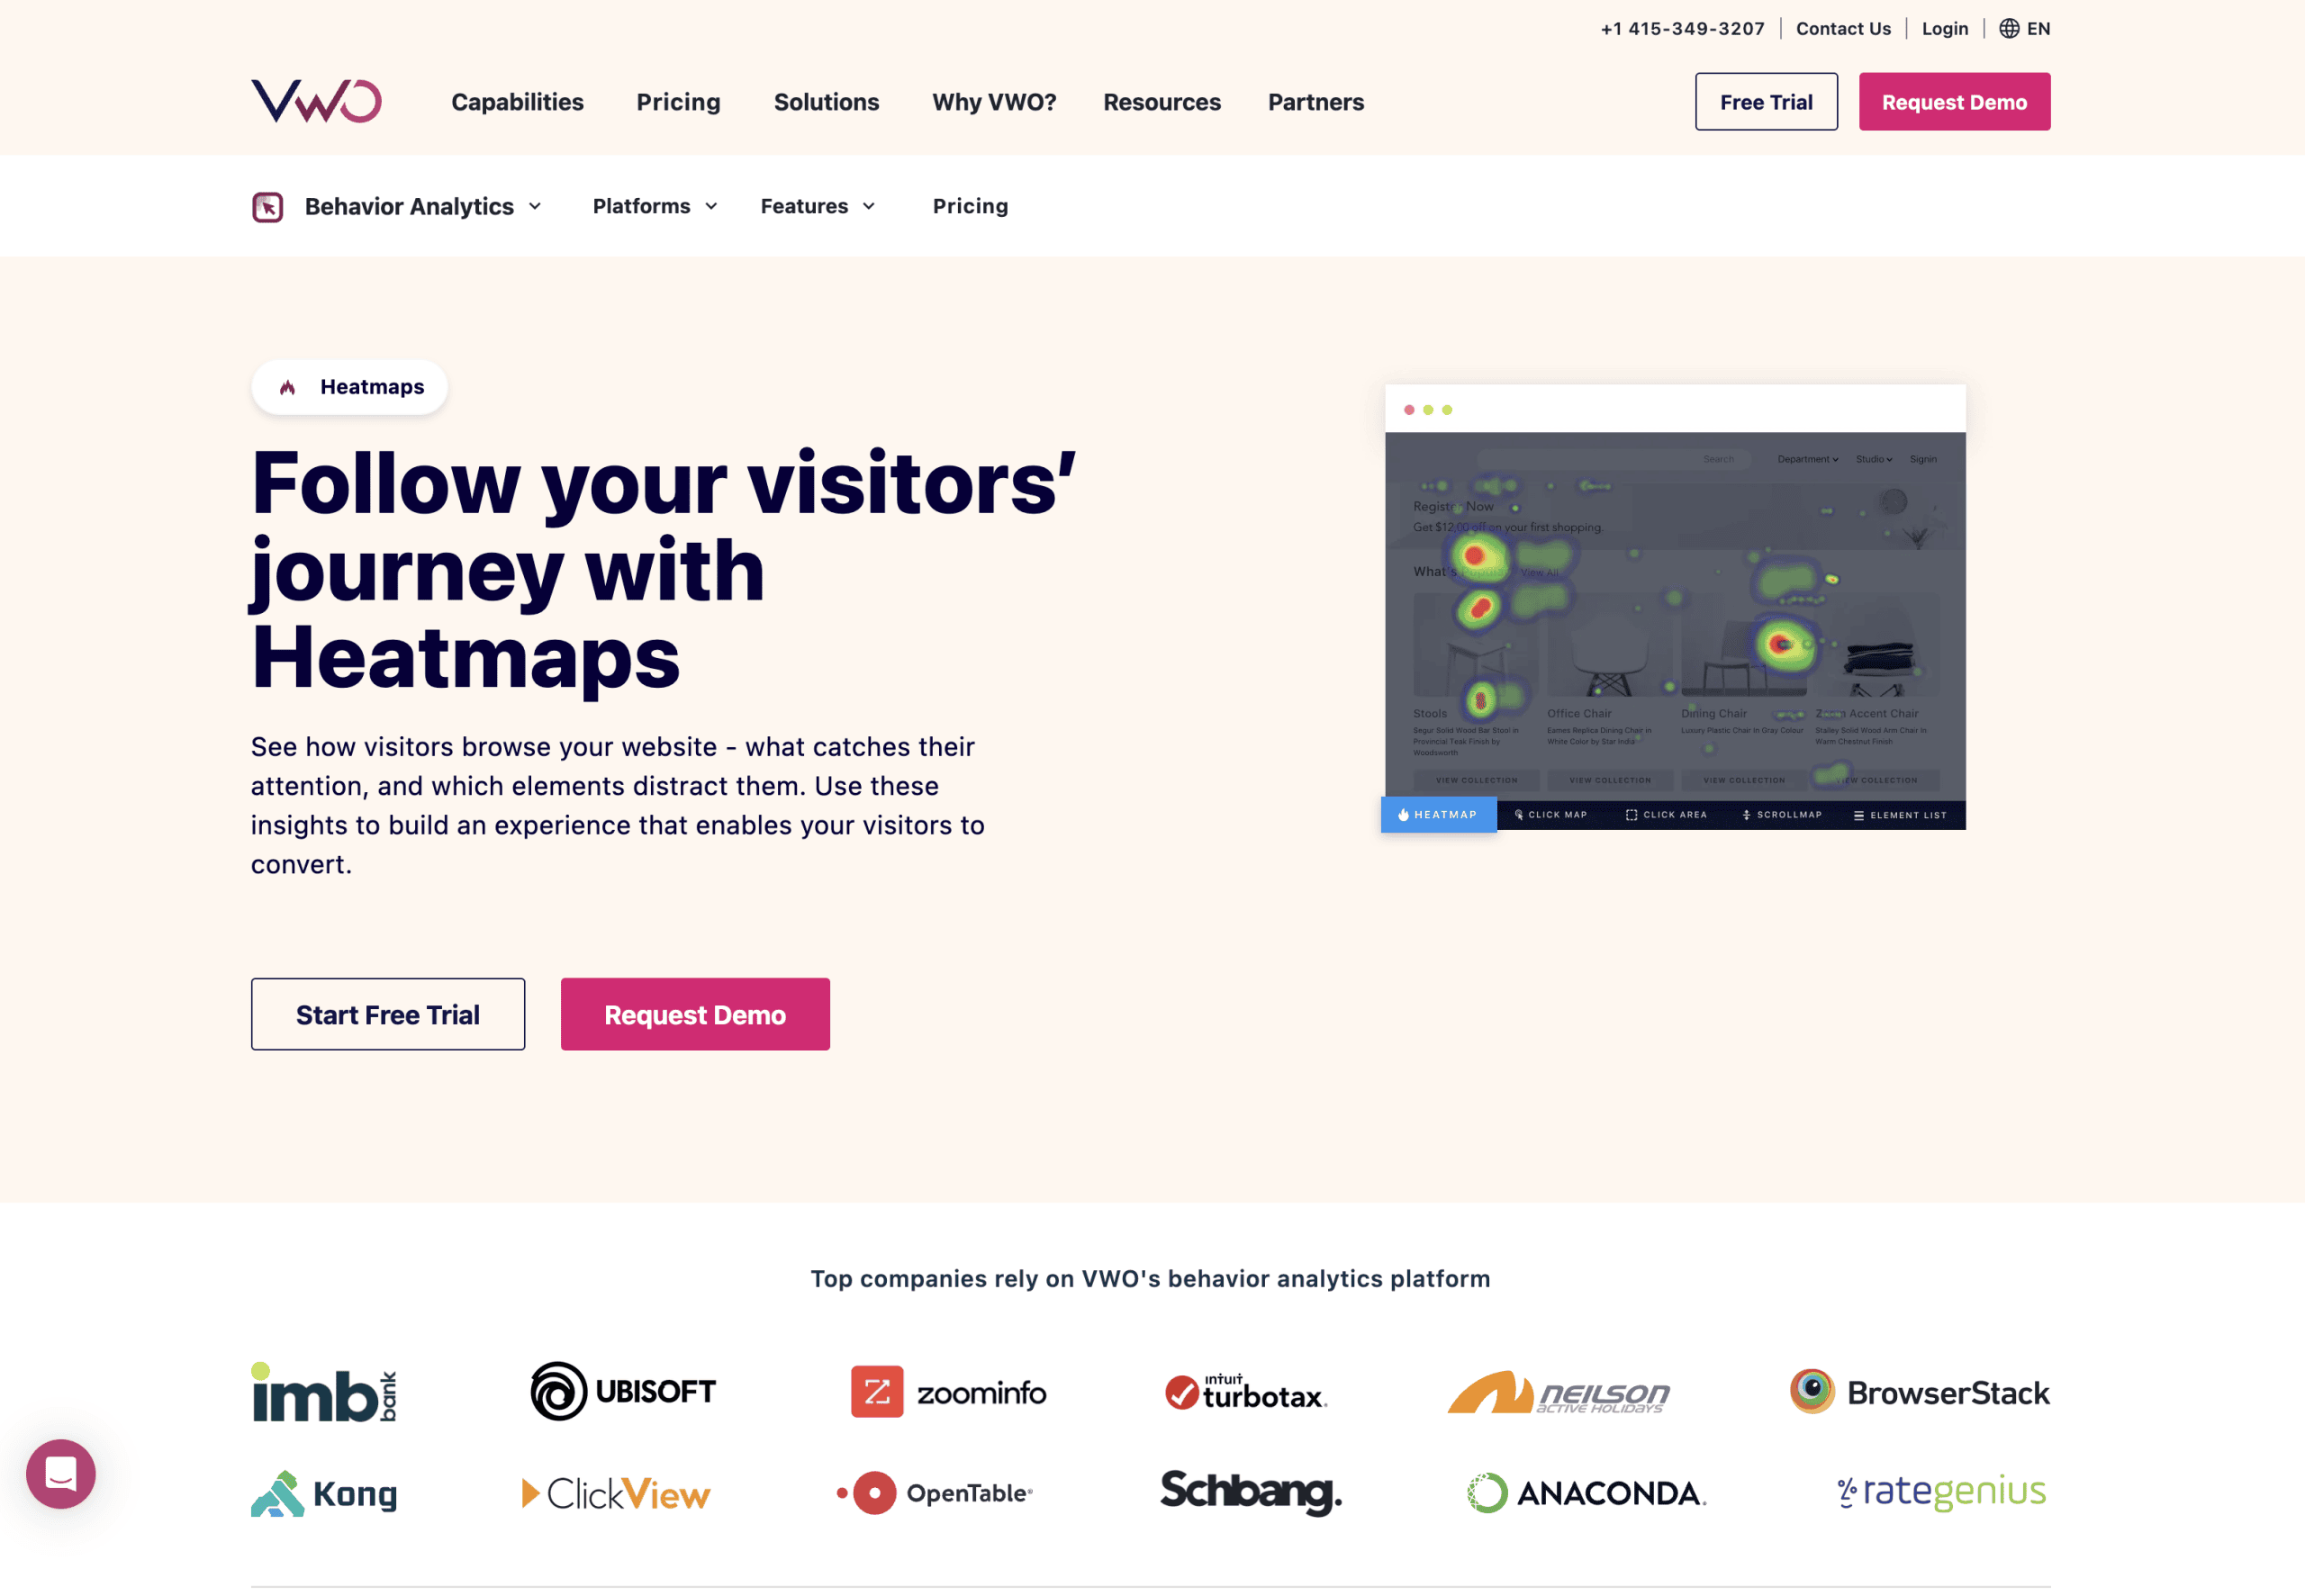
VWO takes an integrated approach by combining heatmaps with A/B testing and session replays in a unified platform. This connected ecosystem makes it easier to move from insight to action.
The ability to segment heatmaps by traffic source, device type, and user behaviors provides more nuanced understanding of different audience segments. This helps create more targeted optimizations.
VWO’s strength lies in its complete testing and optimization suite. While the heatmap tool is powerful on its own, it becomes even more valuable when used alongside VWO’s other conversion optimization features.
This solution works best for medium to large businesses with dedicated conversion optimization teams, companies running regular A/B tests, and organizations that need advanced segmentation capabilities.
| Plugin | Pricing | Standout Feature | Best For |
|---|---|---|---|
| Heatmap.com | Starts at $89/month | Revenue impact tracking | Ecommerce and lead generation sites |
| Microsoft Clarity | Free | Unlimited recordings with Google Analytics integration | Businesses on tight budgets |
| VWO | Custom pricing | Integration with A/B testing | Teams focused on conversion optimization |
| Hotjar | Free plan available, paid plans start at $39/month | User feedback tools alongside heatmaps | UX-focused teams |
| Crazy Egg | Starts at $29/month | Snapshot comparison over time | Small to medium businesses |
This comparison table presents key differences between the top WordPress heatmap plugins. Consider your specific business needs when evaluating which solution best aligns with your goals and budget constraints.
Beyond these specific tools, the WordPress plugin ecosystem offers many options with varying capabilities. The right choice depends on your specific business goals, technical requirements, and budget constraints.
How to Install and Configure a WordPress Heatmap Plugin
Installing a heatmap plugin follows a similar process regardless of which solution you choose. These general steps will help you get started with minimal technical headaches.
Before installation, backup your site. Any time you add new functionality, having a recent backup ensures you can restore your site if unexpected issues arise. This simple precaution prevents potential downtime.
- Choose your plugin – Select the heatmap solution that best matches your needs from the options above
- Create an account – Sign up on the provider’s website and obtain your tracking code or API key
- Install the plugin – Either upload the plugin files or install directly from the WordPress plugin repository
- Connect your account – Enter your API key or tracking code to link the plugin to your account
- Configure tracking options – Select which pages to track and what user interactions to record
Most WordPress heatmap plugins require minimal configuration after installation. The default settings typically work well for most websites, though you may want to customize certain tracking parameters based on your specific goals.
Privacy considerations are essential when implementing any user tracking tool. Ensure your privacy policy discloses the data collection, and consider using cookie consent features if you serve visitors from regions with strict privacy regulations like the EU.
Maximizing Business Benefits from Heatmap Analysis
The true value of heatmaps comes from turning insights into actions. Simply collecting data isn’t enough—you need a systematic approach to analyze and apply what you learn.
Start by focusing on your most important pages. Typically, these include your homepage, top landing pages, product pages, and checkout or conversion pages. Prioritizing high-traffic and high-impact areas yields the greatest return on your analysis efforts.
| Heatmap Insight | Potential Action | Expected Outcome |
|---|---|---|
| Low click rate on primary CTA | Redesign button, improve contrast, or reposition | Increased conversion rate |
| High drop-off at form fields | Simplify form, add progress indicators, improve field labels | Higher form completion rate |
| Content below scroll line rarely seen | Restructure page, add visual cues to scroll, prioritize key content | Better engagement with all content |
| Distracting elements getting clicks | Remove or redesign non-converting elements | Improved focus on primary conversion goals |
This action framework helps translate heatmap data into specific website improvements. Each insight type corresponds to targeted changes that address the underlying user behavior issue.
When analyzing heatmap data, look for these common patterns:
- Ignored content areas – Sections with minimal interaction may need redesign or removal
- Misleading elements – Non-clickable items getting clicks indicate confused users
- Attention hot spots – Areas with high engagement should feature your most important messages
- Friction points – Where users pause or hesitate often indicates confusion or uncertainty
Establish a regular review schedule to track changes over time. Monthly or quarterly analysis sessions help identify trends and measure the impact of your optimizations. This consistent approach builds a culture of data-driven improvement.
Combine heatmap data with other analytics sources for deeper insights. For example, correlating scroll depth with bounce rates can reveal whether content quality or visibility issues are causing visitors to leave.
Common Mistakes to Avoid When Using Heatmap Plugins
Even the best heatmap tools can lead to poor outcomes if used incorrectly. Understanding these common pitfalls helps ensure you get actionable insights rather than misleading data.
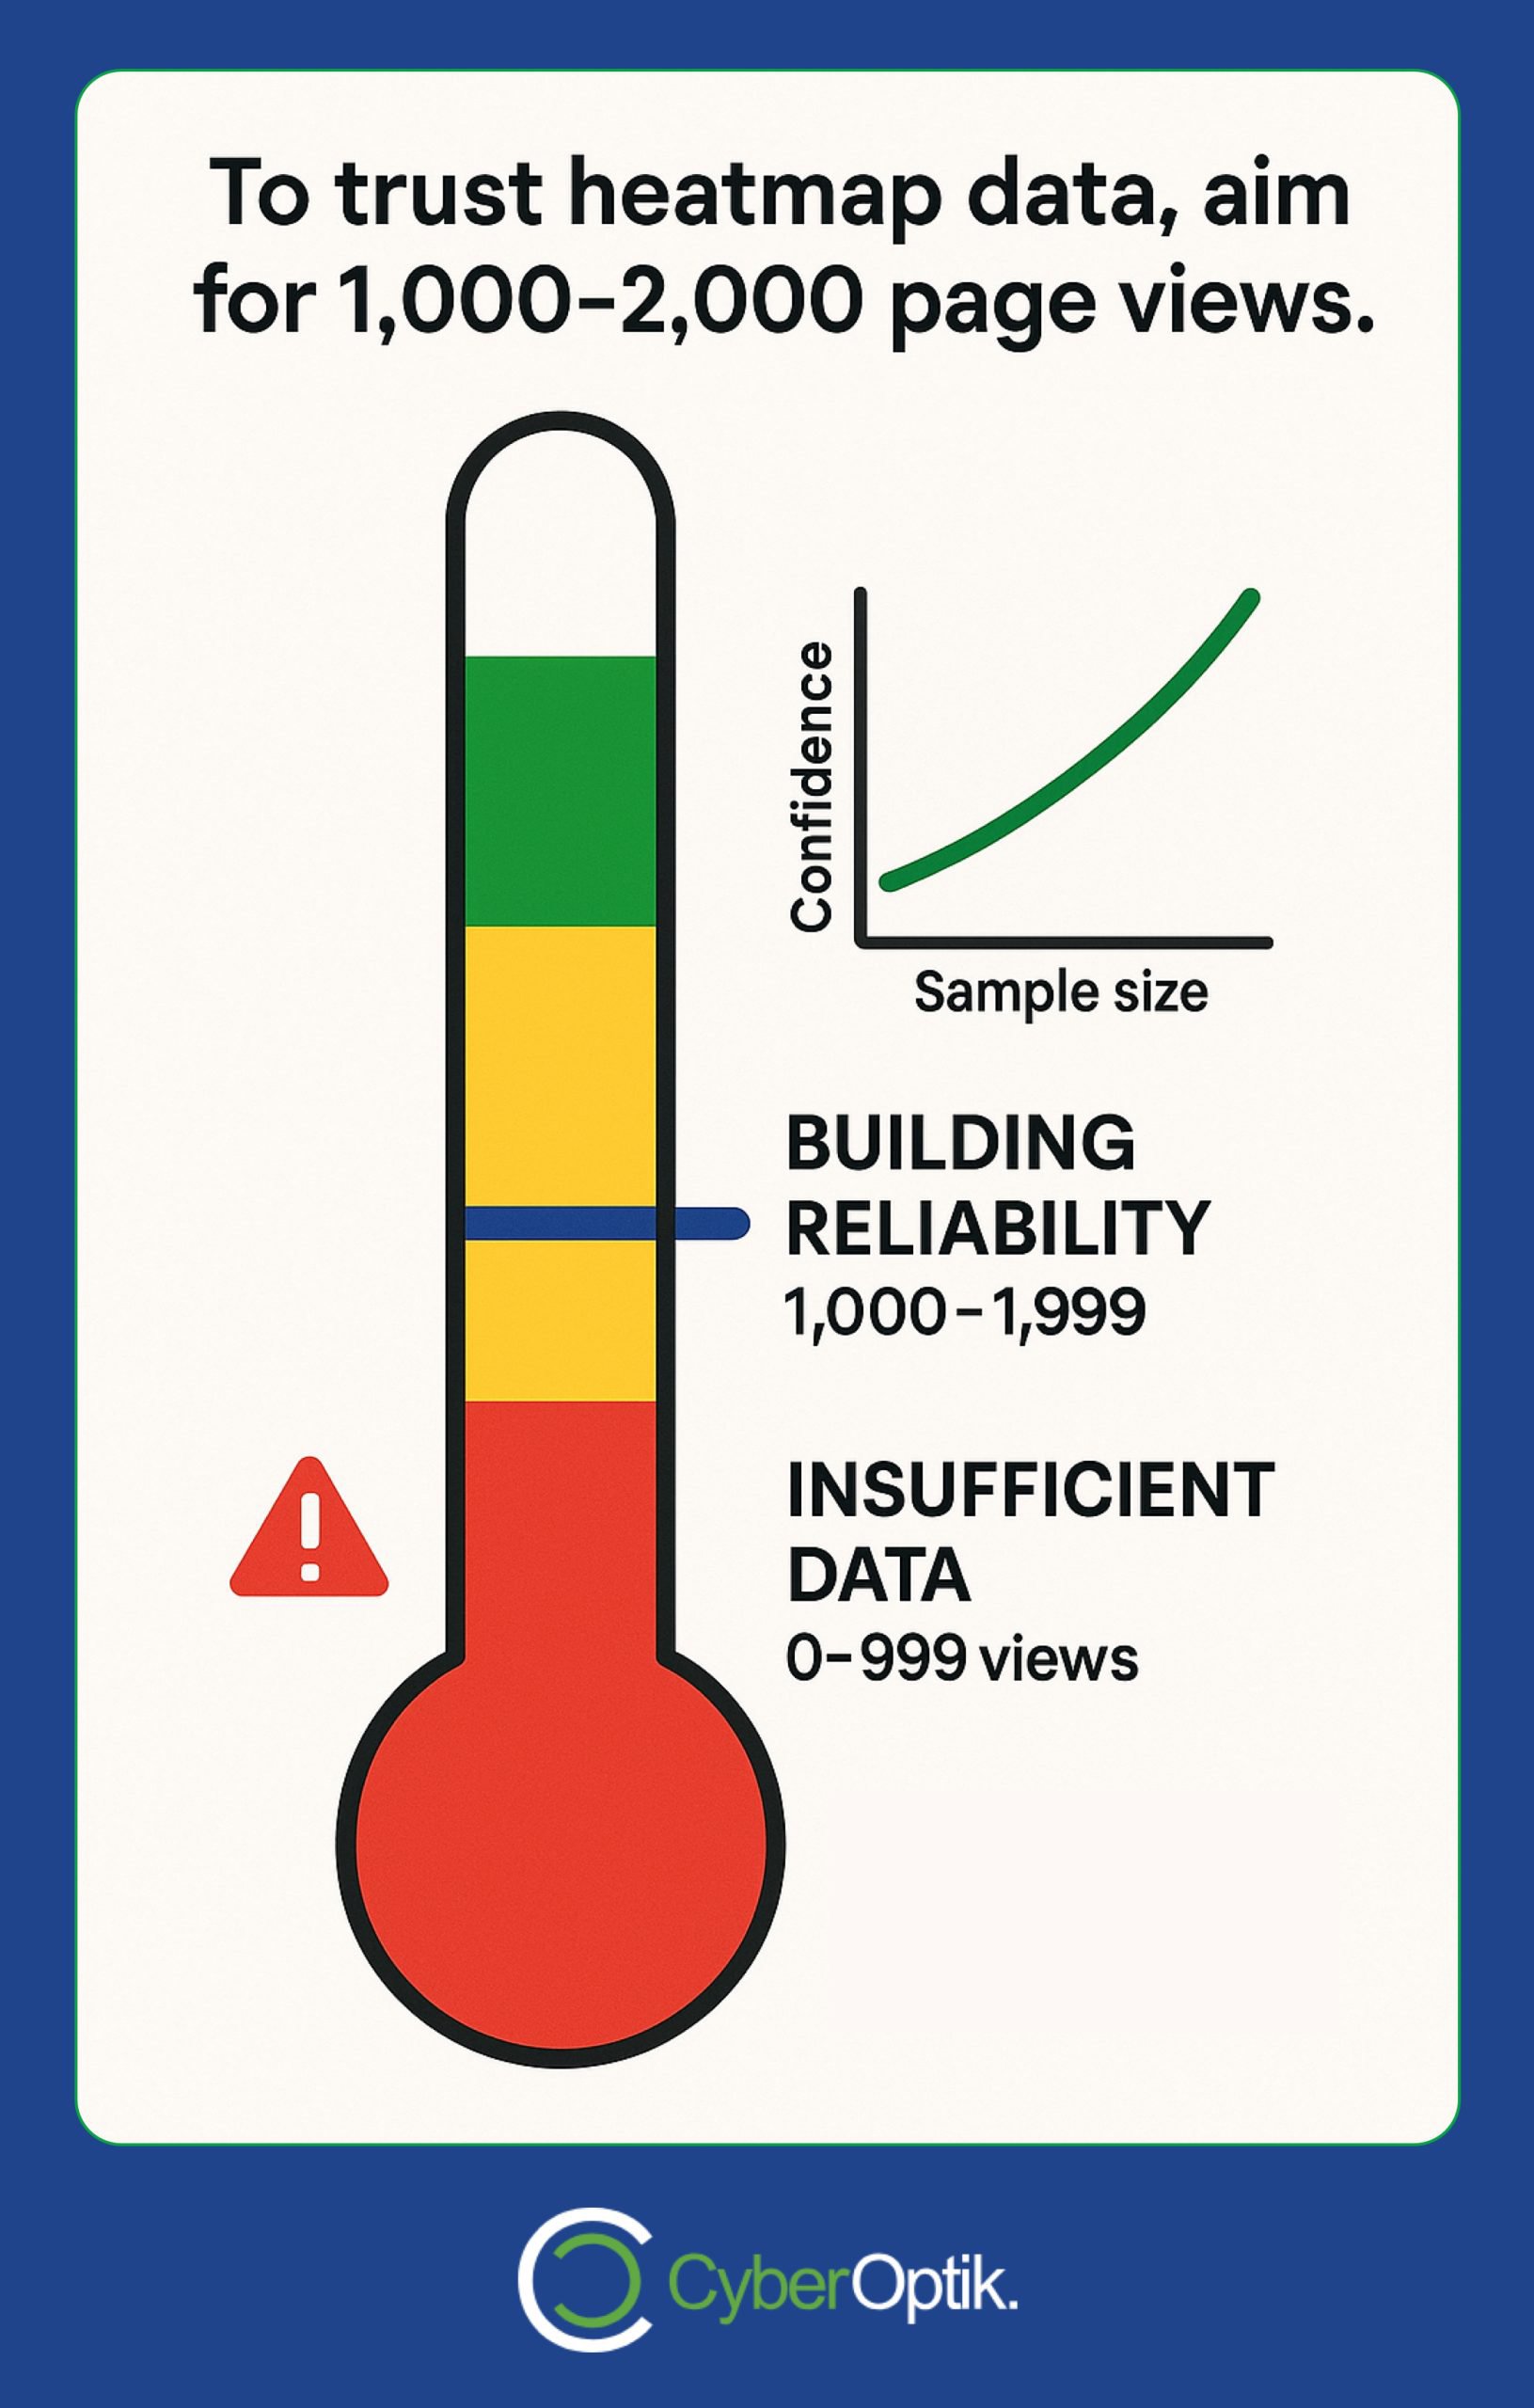
Drawing conclusions from insufficient data is perhaps the most frequent mistake. Wait until you have enough traffic before making significant changes based on heatmap results. For most sites, this means at least 1,000-2,000 page views to establish reliable patterns.
- Ignoring device differences – Mobile and desktop users interact differently with your site. Always analyze these segments separately.
- Overlooking performance impact – Some plugins can significantly slow your site. Monitor page speed before and after installation.
- Making too many changes at once – Implement changes methodically so you can attribute improvements to specific modifications.
- Focusing only on clicks – Click data alone doesn’t tell the whole story. Include scroll and movement analysis for complete understanding.
- Neglecting to test changes – Always validate your heatmap-inspired changes with A/B tests when possible.
Technical implementation errors can compromise data quality. Verify that your tracking code appears on all intended pages and doesn’t conflict with other scripts. Improper setup can result in partial data collection or skewed results.
Remember that correlation doesn’t imply causation. Just because users behave a certain way doesn’t automatically explain why. Supplement heatmap data with user testing or surveys to understand the motivations behind the behaviors you observe.

Conclusion: Selecting the Right Heatmap Solution for Your Business
Choosing the right WordPress heatmap plugin depends on your specific business needs, technical requirements, and budget considerations. Each option offers distinct advantages for different scenarios.
For businesses prioritizing direct revenue tracking and willing to invest in premium features, Heatmap.com provides exceptional insights into how user behavior affects your bottom line. Its asynchronous loading ensures site performance remains strong.
Companies with limited budgets will find Microsoft Clarity offers remarkable value at zero cost. Its integration with Google Analytics and unlimited recording capabilities make it an excellent starting point for user experience optimization.
For teams already focused on conversion rate optimization, VWO’s integrated approach combines heatmaps with A/B testing for a complete optimization ecosystem. This unified platform streamlines the process from insight to implementation.
Whichever solution you choose, remember that the tool is just the beginning. The real value comes from systematically analyzing the data, implementing thoughtful changes, and measuring the results. This ongoing process of improvement drives continual performance gains.
We’ve helped numerous Chicago businesses transform their websites using these exact tools and methods. The insights from proper heatmap analysis often reveal surprising opportunities that traditional analytics miss entirely.
Ready to see what users are really doing on your website? Contact our team to discuss which heatmap solution might work best for your specific business goals and how we can help you implement it effectively.